Data Rich, Information Poor
January 01, 2016
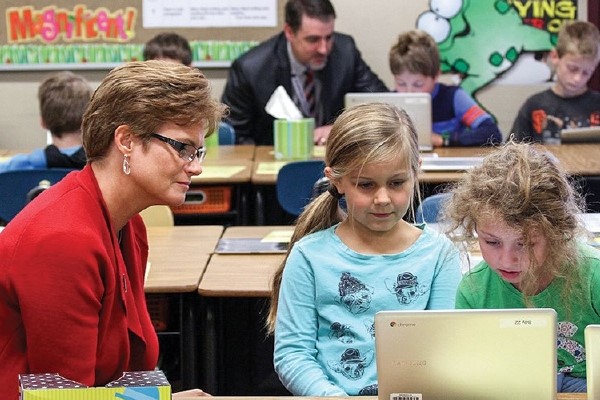
During our in-service training in August, a few days before the start of the school year, we asked teachers to create a list of all the data sources they use to determine student progress and learning needs. We collected pages upon pages of sources such as summative tests, formative assessments, projects, report cards, teacher notes, parent conferences, and a wide array of specific, self-made items.
Clearly, our schools and teachers (not to mention the school district, state and federal government) are collecting a massive amount of data, but to what end? The critical question remains this: How usable are the data for increasing student learning?
Without tools that organize and categorize the volumes of data, we become frustrated and overwhelmed with disaggregated tables and indigestible spreadsheets. Effective school systems organize data so the numbers have practical value in the hands of a classroom professional. For school district administrators that means vetting and adopting technology tools that allow teachers to access useful data to seamlessly drive their instruction.
Mapping Guidance
To be useful, data should function like a global positioning system, offering guidance on instruction to ensure all students are on the road to reaching their highest potential. We need this “roadmap” vision to build and operate personalized learning systems that turn raw data into useful information and give teachers effective tools to meet the needs of all students. With data-driven instruction, teachers can move students further faster and fill gaps more quickly, and students are empowered to set their own goals and manage their education pathways.
Educators are beginning to have access to tools that uncover useful information gathered from the mountains of data we collect. What’s more, we are able to use the knowledge that comes from the organization and presentation of that information.
If we learned anything from the first wave of data dashboards for education that swept through schools and districts, it’s that simply taking tools made for business and rebranding them for schools did not give us the knowledge we needed. Scores of dials showed us attendance trends and state test scores and even classroom performance, but many times these information points were converted into dials that told us if the trend was “in the red” or if we were keeping it “in the black.” These dashboards came up short by not turning numbers into actionable measures.
Getting the Data
In the classroom, many teachers use “clickers” as a formative assessment strategy, using student response data to guide their instruction. While this use of classroom data is helpful, the assessment results are not necessarily connected to any other student learning information and simply generate quick point-in-time data for teachers to inform and adjust their instruction.
However, what if teachers were able to see data points along a timeline? Recently, Lake Oswego School District in Oregon began the review process of early warning systems to pinpoint areas where students are struggling academically much sooner in their education careers than we have been able to in the past.
These early-warning systems process large amounts of data about assessment, attendance, grades, reading levels and math abilities. When the system identifies students who are at-risk based on indicators of poor performance in reading, math or science, teachers are alerted so they can plan and implement interventions. Teachers who have been using formative or summative data gathering gain a clearer picture of their students as the data build a body of evidence over time.
With the introduction of computer-adaptive assessment systems, such as Smarter Balanced, we continually receive better and more focused data points about what students know and are able to do. With larger data sets, organized into better information collections and delivered as a body of knowledge about a particular student, schools have an even better chance of individualizing students’ learning experiences.
Predictive Analytics
Early-warning systems are great for alerting us to struggling students based on historical factors, but the next-generation data tools use predictive analytics to extract information from the data sets, highlight patterns and predict outcomes. This information helps teachers and principals go one step further and determine the interventions and learning experiences that will help each student.
For example, a 3rd-grade student who is not demonstrating grade-level reading scores is no longer on track to be career and college ready. In this case, early-warning systems would give us nine years to select and deliver interventions to get that child back on track. By providing teachers early on with insight into students who may be at risk, we equip them with the knowledge they need to help their students succeed.
In addition to analyzing needs and predicting outcomes, many systems help teachers identify what teachers need to learn and do in order to meet their students’ needs. Rather than prescribing the same training for all teachers, professional learning and development software packages integrated within a predictive analytics system can target training for individual teachers based on the data about their students.
Personalized professional development in real time, in small doses, tied directly to individual student needs, may become the norm in a few short years. While they are at the dawn of their arrival in education, predictive analytic systems are poised to uncover knowledge from the mountains of data and information we currently struggle to understand.
Students in Charge
Recently we’ve also seen the rise of tools that help students track their own learning progressions. Akin to a Fitbit or other activity-monitoring device, these systems provide students with instant feedback about their learning and, like a video game, allow them to accumulate achievements. Personalization allows students to own their learning which, in turn, motivates them to learn.
Application program interfaces, or APIs, such as mobile learning, simulations, virtual worlds, real-world activities, experiential learning, social learning, offline learning and collaborative learning, allow students to keep track of their learning experiences and build their own “learner profile.” The profile keeps track of what they’ve learned and what skills and knowledge they still need to acquire.
Unfortunately, these kinds of apps focus largely on intervention skills such as remedial reading, and there is still a disconnect between the data they provide and daily classroom instruction. Consequently, teachers end up “teaching to the middle.”
The Road Ahead
We always have known that each student is unique, and now we are able to collect and access data and leverage GPS-like systems to personalize education and direct those individual students down the appropriate pathway to reach their goals. No doubt, the future will bring us even more effective tools and resources, but they will only be as effective as the people who use them.
Even with the best information and knowledge tools at their fingertips, success lies in the wisdom of the highly skilled and trained teachers who will ultimately make the final decisions. As the old adage says, “It takes knowledge to understand that tomatoes are a fruit, but it takes wisdom to know they don’t belong in a fruit salad.”
Additional Resources
The authors recommend these resources related to their article.
- BrightBytes Early Warning system, http://brightbytes.net/-solutions/early-warning/
- Guide K12, geovisual analytics for education, http://guidek12.com
- LoudCloud classroom dashboard with predictive analytics, http://loudcloudsystems.com/class-dashboard/
- Tin Can API, student achievement badging, used by several education providers, https://tincanapi.com
Advertisement
Advertisement

Advertisement
Advertisement