Devising a Holistic Data Dashboard
January 01, 2023
A university team collaborates with a Massachusetts district on leveraging new information for schoolwide improvement

Last spring, leaders in the Lowell Public Schools in Massachusetts gathered to think through what it means to be data-driven. Although it seemed that all school leaders understood the expectation to use data for improvement, many had questions about how to execute that work.
Each school principal was required to submit an annual improvement plan using data to identify a problem and set measurable goals. Yet as is typical in many school districts, leaders in Lowell had access to only a limited range of data — chiefly the results from state standardized tests. When district leaders reached out to faculty at the University of Massachusetts Lowell last spring to address this limitation, we jointly decided to forge a research-practice partnership to learn the answers.
Problem Diagnosis
Our team of school district and university personnel started by diagnosing the problem. Consulting existing research, conducting districtwide surveys and talking with school leaders and classroom educators, we came to realize the problem was far from simple.

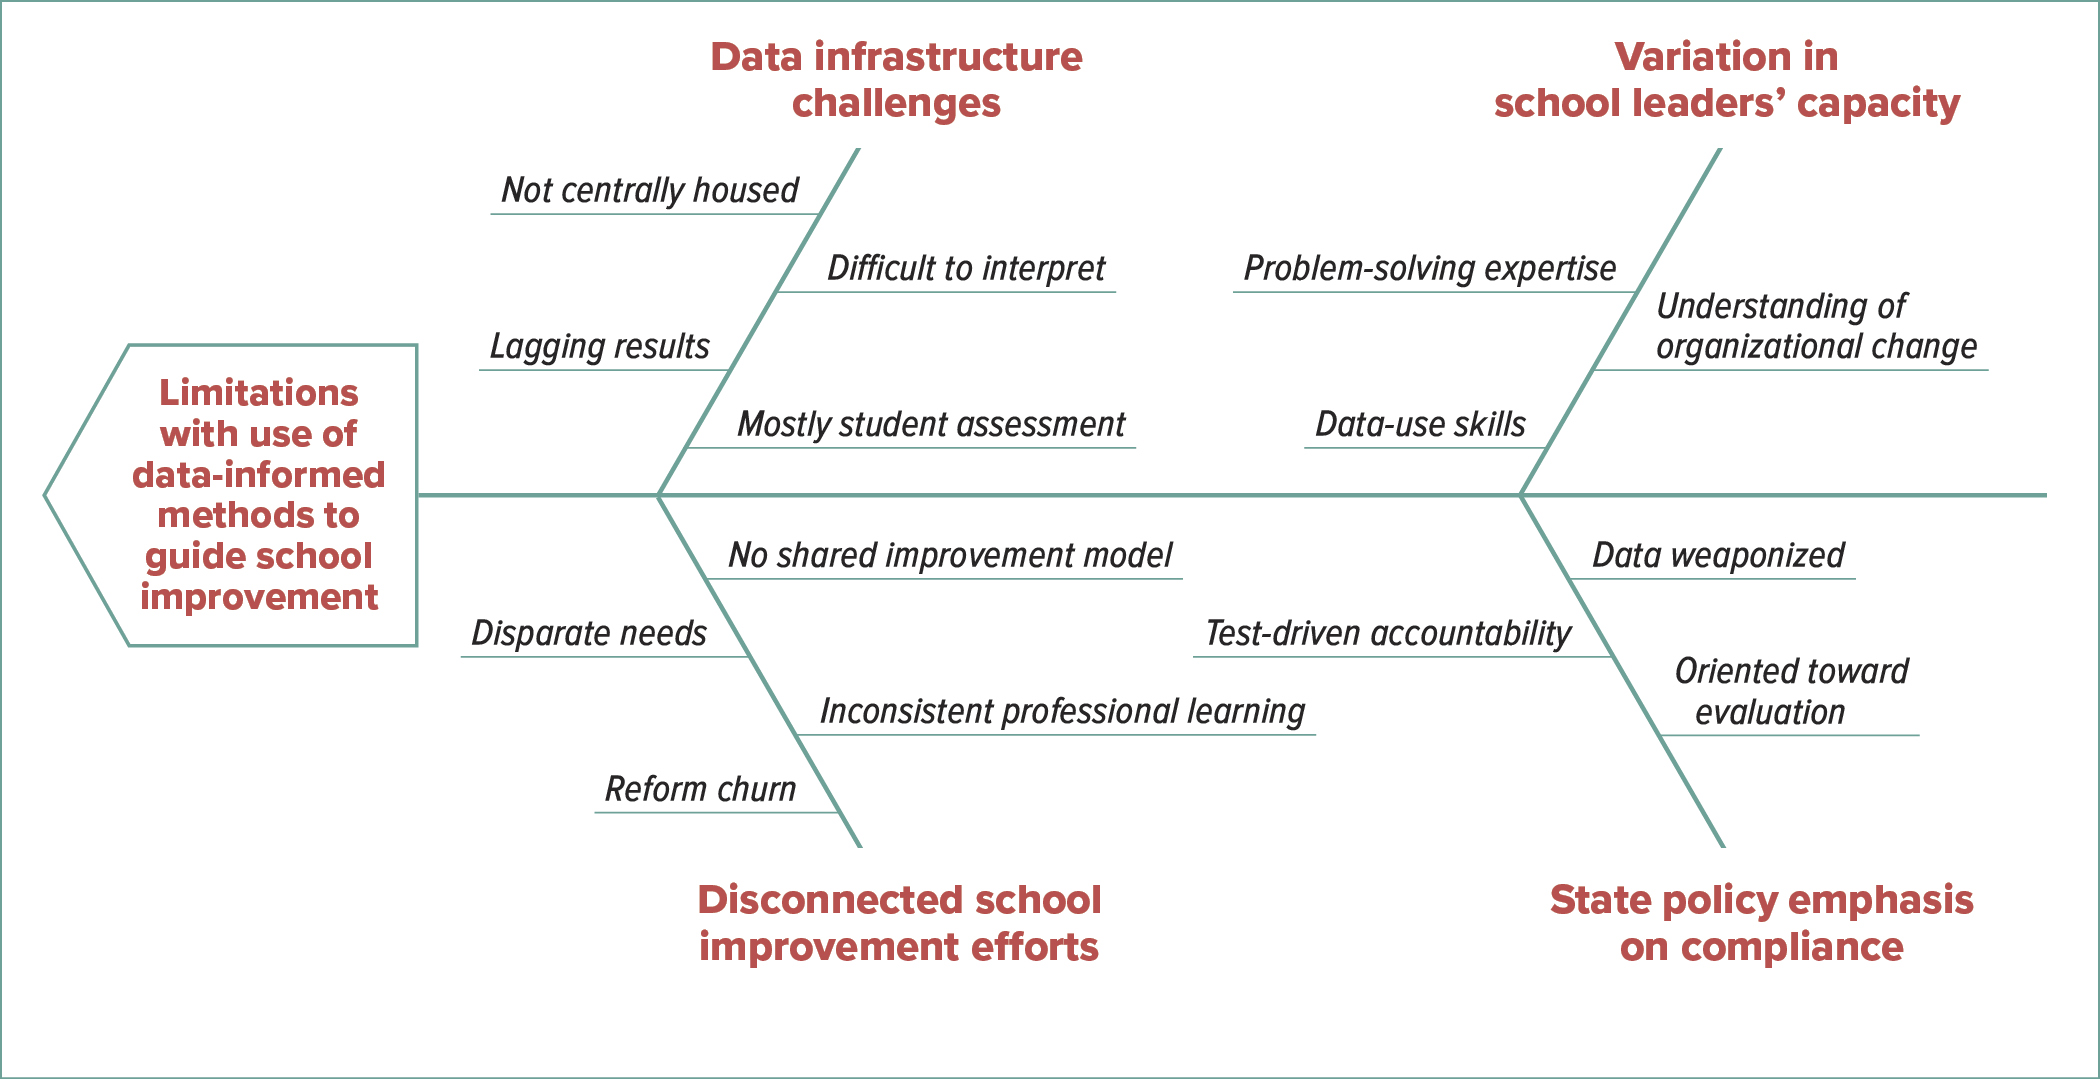
As illustrated in a fishbone diagram (see left), confronting this problem would involve addressing the school district’s data infrastructure challenges, disconnected school improvement efforts, a policy environment shaped by state control, and differing levels of capacity among school leaders. In other words, it would require us to simultaneously tackle several drivers of change to build a system of support — one designed to equip educators to use data for improvement.
Driver 1: Strengthen data infrastructure with a new data dashboard.
First, we needed a way to provide educators with better data. Educators were hungry for measures beyond state test scores, which were too narrow to inform their decisions and often were presented in a manner better suited for rating schools than improving them.
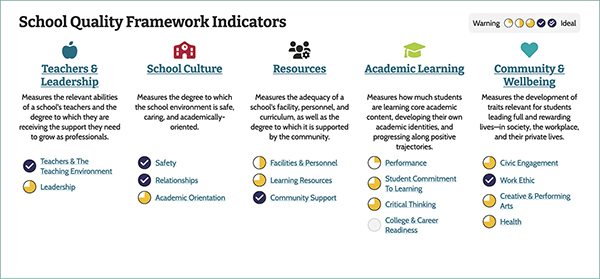
To address these needs, district leaders decided to adopt two online data dashboards. One provides data typically collected by the state. Another, however, is a more holistic platform developed by a consortium of Massachusetts school districts working with university researchers. This holistic dashboard (see graphic below) visualizes school quality in five categories: teachers and leadership, school culture, resources, academic learning and community and well-being. Using teacher and student survey results, as well as underused administrative data like teacher turnover and student access to arts instruction, the dashboard allows users to break down results in various ways.

Driver 2: Forge stronger connections across school improvement efforts.
To develop more consistency and strengthen connections across school improvement efforts, we convened a design team of committed educators serving in various roles across the district. These educators would bring their unique knowledge of context to the collaboration with university researchers, while also serving as trusted supporters of the work.
The design team would meet throughout the year to oversee the project with two charges: first, to customize the dashboards to ensure they included data and displays that leaders would find useful; and second, to co-develop and facilitate the yearlong professional learning series.
Driver 3: Build school leaders’ capacity to execute improvement.
As educators reported, structuring school improvement would require more than just access to useful data. It also would require new forms of know-how.
Consequently, district leaders decided to leverage our partnership to provide professional development for all principals and assistant principals. Through a three-day institute in August and a monthly daylong institute throughout the year, the learning series would assist leaders in interpreting school quality data, while also teaching a method of continuous improvement rooted in what the Carnegie Foundation for the Advancement of Teaching calls improvement science. These methods involve a series of steps for organizational problem solving and emphasize a more collaborative approach to change.
Driver 4: Counter a focus on compliance with a focus on systemwide learning.
Finally, educators in the district also sounded a warning: Calls to use data may require substantial unlearning. For example, at so-called turnaround schools flagged by the state for low test-score performance, leaders and teachers reported what they often referred to as “PTSD” from past uses of data. Often, data were collected by outside entities and sent to the state department of education as a way of monitoring compliance, and to many stakeholders it felt more like a weapon than a tool.
To cultivate a culture of continuous improvement, we would have to work against some of the norms set by the state — for instance, the idea of data as a tool used primarily for the enforcement of compliance. Instead, we would need to intentionally frame data as a tool for learning.
Addressing Challenges
Our work in the Lowell Public Schools is still new, and the partnership will continue to develop in the coming years. Already, however, we have learned four important lessons about how to enable school leaders to engage in more meaningful data-informed improvement.
Learning 1: A district design team helps to create a more consistent model for improvement.
About 15 educators — district administrators, principals, assistant principals and teachers — volunteered to join the design team. Over several meetings, they explored data on two new dashboards. Team members immediately became intrigued by the results on the holistic data dashboard, which revealed new insights about school quality.

But they also quickly recognized that encouraging leaders to use such data for improvement would require a consistent approach and regular opportunities to practice. Principals and assistant principals on the team insisted that learning this should not seem like something extra.
With this in mind, the design team planned a yearlong professional learning series organized around a learning-by-doing approach for leaders to develop and apply a common method of improvement to their own schools.
Learning 2: Leaders experience new holistic data as game-changing.
After this experience, design team members eagerly planned a rollout of both new data dashboards at the upcoming summer institute, which was held this past August just before the start of the school year. But they worried it might be overwhelming. How would school leaders react to all of this new information? Would other leaders in the district dismiss the new data? Would they still gravitate toward test results?
As it turned out, those anxieties were misplaced. Leaders did not find it overwhelming, and they did not narrowly gravitate toward traditional data. Rather, they found the array of data now at their fingertips to be game-changing.
School teams alternated between consulting traditional data and the new school quality measures dashboard, noting areas of alignment and discrepancy that opened up new and interesting conversations. When school teams were asked to record a priority for improvement, most focused on core issues shaping the quality of students’ education: how to better engage students in their learning, strengthen their school community and improve students’ social-emotional well-being.
Learning 3: Improvement science builds leaders’ problem-solving capacity.
Improvement science emphasizes the importance of understanding problems before leaping to solutions. One key step in this process is to dig below the symptoms of a problem and identify its root causes. At the institute, leaders appreciated activities like the “five whys” and used tools like a fishbone diagram that helped them to name root causes.
At our leadership institutes, the root-cause analysis proved to be a powerful tool for challenging leaders’ ideas about the right problem to focus on. For example, one school team that had identified low test scores as their focal problem turned to the holistic data dashboard for insights about what might be causing it. They noticed on this dashboard that teachers had rated their students’ engagement in learning as rather low. This finding suggested that engagement could be a root cause of the test score results — and a better problem to target for change.

Learning 4: Collaboration encourages the use of data for learning.
School leaders raved about having time to collaborate on applying new techniques, and they particularly appreciated hearing that their work on these days was not a final product or a new set of mandates. Rather, they were encouraged not only to share the data at their school sites but also to invite teachers and students to have a say in selecting an improvement focus and identifying root causes. They also will introduce more faculty to the steps and tools of improvement science.
Work in Progress
In the coming months, leaders will have more opportunities to practice using data with improvement science methods. This includes setting short-term goals, designing and implementing small-scale interventions, and continually monitoring progress through practical measures — work that can happen repeatedly in relatively short six-week cycles.
Meanwhile, the team from the University of Massachusetts Lowell will continue researching leaders’ use of data and application of improvement science methods and adjusting supports to meet the demonstrated needs of educators. Documenting the work of the partnership as it unfolds, our hope is to learn how to design the right system of supports for educators and to learn how this work can succeed elsewhere.
ELIZABETH ZUMPE is visiting assistant professor in education leadership at the University of Massachusetts Lowell.
@LizZumpe
JACK SCHNEIDER is associate professor of education at the University of Massachusetts Lowell and the executive director of the Education Commonwealth Project.
Contributing to this article were DERRICK DZORMEKU and ABEER HAKOUZ, Ph.D. students in education at the University of Massachusetts Lowell, and PETER PIAZZA, director of school quality measures for the Education Commonwealth Project.
Carnegie’s Improvement Science Tack for Holistic Data
In recent years, the Carnegie Foundation for the Advancement of Teaching’s work on improvement science has offered new ways to approach school improvement that go hand in hand with the use of more holistic school quality data.
Traditional test score data typically focus on a narrow set of outcomes. While these data may provide snapshots about how the system is performing on particular metrics, they do not usually help with knowing how to improve.
Improvement science, on the other hand, brings attention to school and district work processes. The first step of improvement science is usually identifying a problem of practice. This requires being able to determine challenges occurring in the work practices in various parts of the organization and what is causing those problems. District leaders usually cannot identify this by looking at test scores alone. Rather, they need data offering a broader view of what is going on in schools and of the quality of students’ educational experiences.
Because most problems of practice in education are complex, improvement requires taking the time to understand the problem itself.
For this, leaders need holistic data to, as Carnegie expresses it, “see the system” that is causing problems. This complexity also means that many solution ideas are, at the outset, “possibly wrong, and definitely incomplete” (a favorite phrase of the Carnegie Foundation).
Improvement requires leaders and school teams to learn how to solve the problem along the way. This means trying out change ideas and collecting a variety of data that reveal if solutions are working, for whom and under what conditions.
Unlike data about test scores, which are collected once to a few times per year, data for improvement should be gathered quite frequently. Rather than monitoring for compliance, district leaders use data for improvement to identify successes and flaws in their solutions early and fast so they can make thoughtful adaptations to aim for better results.
To learn more about the Carnegie Foundation’s improvement science approach, visit www.carnegiefoundation.org/our-ideas/six-core-principles-improvement.
— Elizabeth Zumpe and Jack Schneider
Ready Tools for More Authentic Student Assessment
The Education Commonwealth Project at the University of Massachusetts Lowell offers free, open-source tools to develop data dashboards — similar to the one used by leaders in the Lowell Public Schools.
At the core of the work is the School Quality Measures framework, which is organized around five key categories: teachers and leadership, resources, school culture, community and well-being, and academic learning. Each category consists of several subcategories, each informed by multiple indicators. All districts nationwide are welcome to use and adapt the framework for their own local context.
The indicators aligned with the School Quality Measures framework also are available on a free and open-source basis. Districts that want to assess constructs such as student engagement, social and emotional health or curricular strength and variety can easily access the project’s field-tested student and teacher surveys, as well as the administrative data collection guides and walkthrough protocols. Even the source code for the data dashboard is freely available to anyone.
Finally, for those districts looking to experiment with new ways of assessing student learning, the Education Commonwealth Project’s Quality Performance Assessments also are available on a free and open-source basis. These teacher-generated tools allow educators to more deeply and authentically assess what students know and can do, and they are designed to be embedded in day-to-day instruction. For districts in Massachusetts, the Education Commonwealth Project offers additional no-cost support for customizing the School Quality Measures framework, using data collection guides and walkthrough protocols, or designing Quality Performance Assessments.
To download any of these tools or to learn more about the project, visit www.edcommonwealth.org.
— Elizabeth Zumpe and Jack Schneider
Advertisement
Advertisement
Advertisement
Advertisement


